Solver’s Report Templates menu allows users to run reports from within a modern web interface. Quickly and easily, run reports that you have created or that have been shared with you, and Drilldown on this data to view the details of the transactions.
Highlighted Features and Functionality
Solver’s Report Templates provide an organization with a centralized location for viewing and running reports.
- View and run reports that have been shared with you.
- Solver’s Data Access ensures that users see only the data that they have access to.
- With the appropriate permissions, users can export data to Excel and drill down on the details.
- Visuals such as tables and charts are all supported within the web interface
- Due to the complexity of tables and charts, there may be some cases where these visuals do not render on the web. Please contact Solver Support if you are experiencing this
Restrictions and Limitations
The following restrictions have been put into place to ensure a good reporting experience.
- One nested expansion row cannot expand more than 100,000 rows
- Drilldown cannot render more than 100,000 rows
- A report is restricted to 1 million cells of data, defined as the number of cells from the upper-leftmost cell where data came from the database to the lower-rightmost cell.
Pre-Requirements and User Permissions
In order for a user to run reports, they must be
- Added to the application and assigned a Reporting license.
- A designer license is required in order to create reports.
- Various permissions, as described here, will give users access to additional functionality such as Drilldown.
- Set up data access control to ensure users see only the data they should have access to.
Menu and Interface
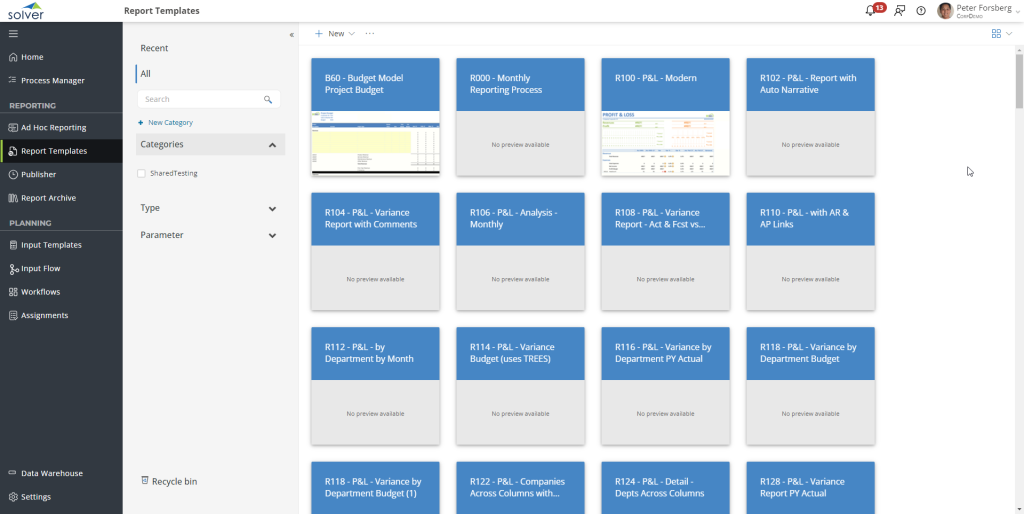
The Report Templates menu has four (4) main sections
- The main grid, which shows reports as tiles or in a list, depending on the user’s configuration
- Search and Categories Side Panel, where categories that you have created or that have been shared with you appear. Use this panel to filter or search for reports that you are looking for.
- Action bar: found at the top of the browser, this contains actions such as New, Add to Category, and Delete.
- Settings: found in the upper right corner of the Report templates menu, use this menu to change your settings, such as list/card view.
Selecting Reports
Depending on your view, there are different ways to select reports
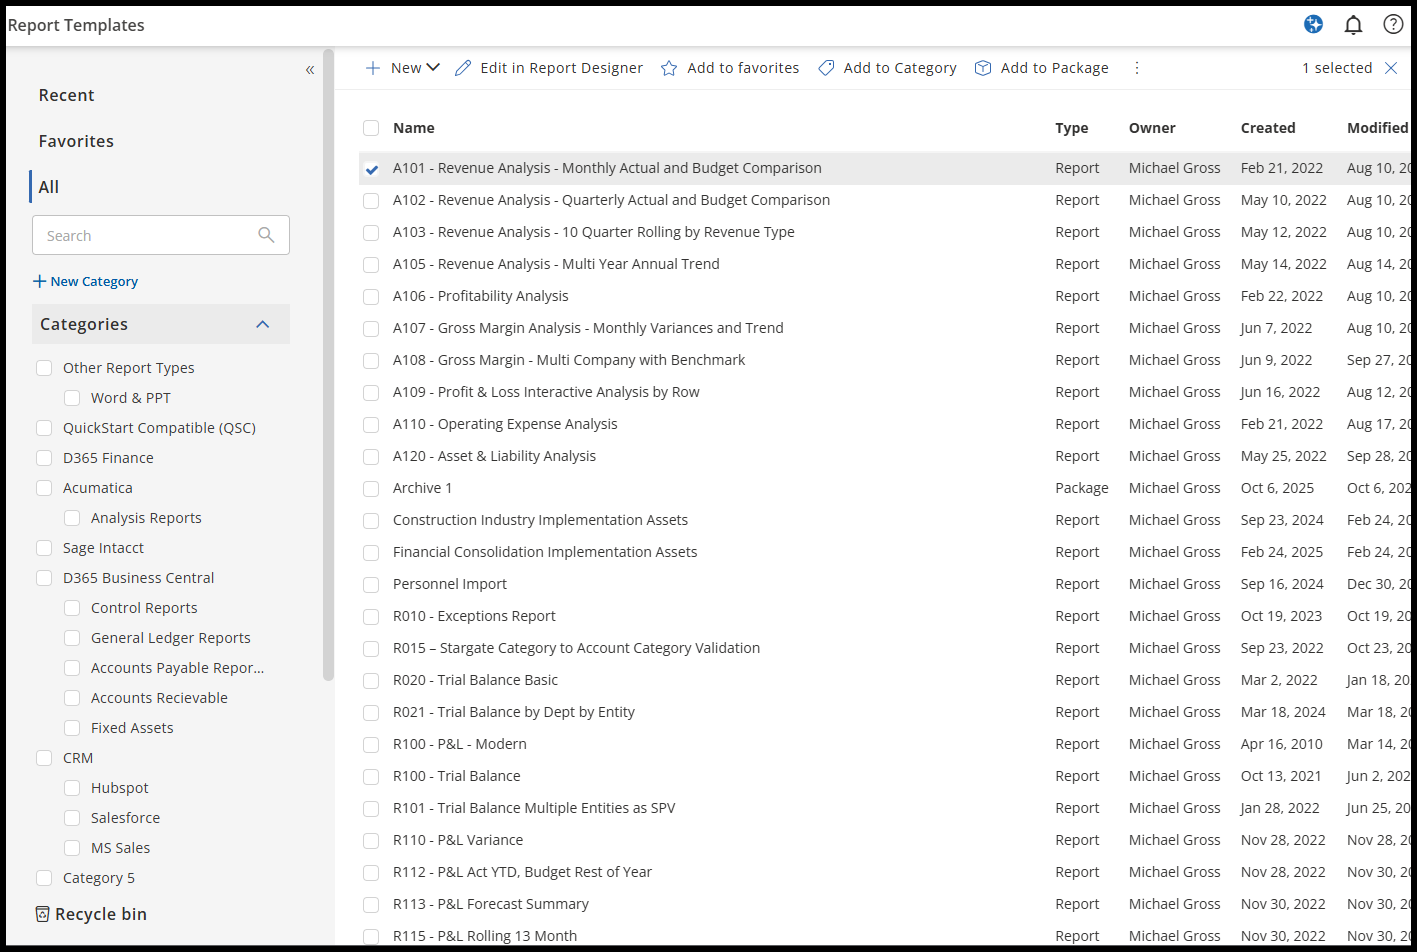
- List view: click the checkbox next to the report title that you need to select. Click the checkbox on multiple items in the list to enable multi-select.
- Card View: Click the Check in the Upper left-hand corner of the card. You can click the checkmark on multiple cards to select them.
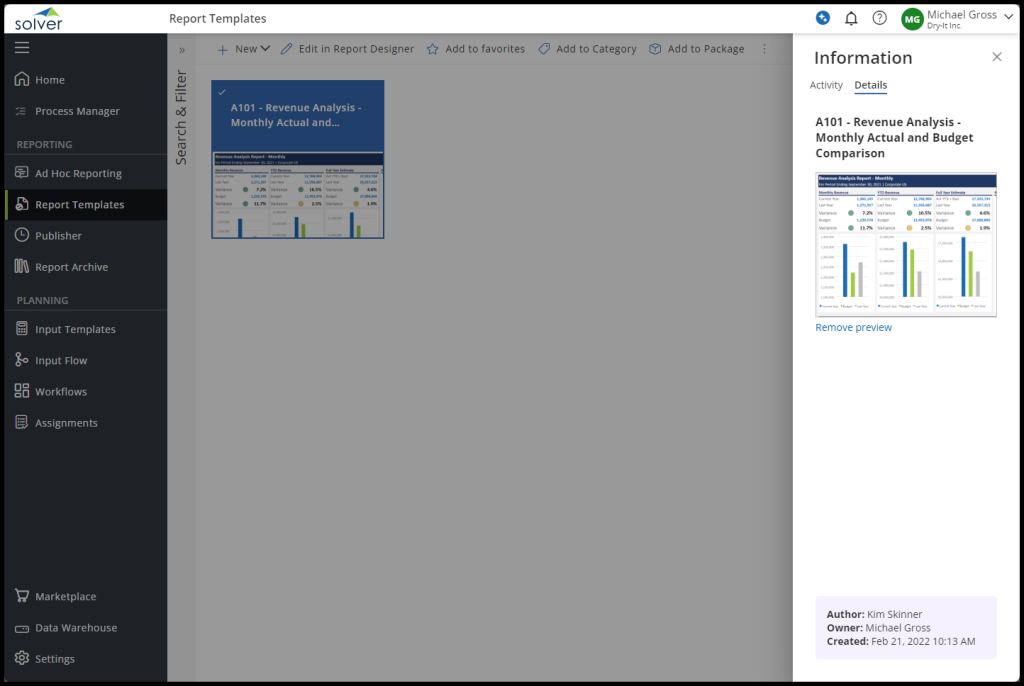
In Card View, users can view their reports as partial thumbnails. To see more information about their report without fully opening it, users can select the report and click the information menu on the right side of the page. This will only work if the user has selected only one report. Opening this menu will provide the user with information about the report’s activity, including published modifications, and details such as the full name of the report, a full thumbnail preview, the author, the owner, and the date and time the report was created.
Creating Your First Report
To create your first report, as a Report Designer
- Log in to Solver and navigate to Report Templates
- In the upper left-hand corner, click New > Report Template.
- In the pop-up that appears, provide a descriptive name for this Report and click Create.
- The pop-up will close, and a secondary pop-up may appear asking if you’d like to launch Report Designer. Click OK.
- Excel will open, and Report Designer will load.
- Drag the appropriate fields into the report. Once completed, click Save to save your changes to Solver.
- If this is a brand-new report, saving it in Excel makes it a draft in Solver.
- If this is an existing report in Solver, a “new” draft of the report is created. This draft is a newer version of the report and is available only to you. Other users who you have shared the published report via a category will not see these changes until you publish the report
Editing a Report Name
To edit a report name
- Select the report that you want to edit.
- In the action bar, click the ellipsis (….) > Rename.
- The current title of the report will appear.
- Type in the new name and click Rename. Click Cancel to exit this action and not save any changes.
Duplicating a Report
It is sometimes required to duplicate. This is a quick and easy way to create a copy, whether you are
- Looking to create a variation of a report
- Looking to test out some new reporting techniques, but don’t want to “break” an existing report.
To duplicate a report:
- Select the Report to be duplicated
- Click the ellipsis (….) > Duplicate.
- A pop-up will appear. Type the new name for the duplicated report, then click Duplicate. Click Cancel to exit this process and not create a duplicate report.
Removing, Deleting, and Restoring a Report
To delete a report in Solver, you must first move it to the Recycle Bin and then permanently delete it from there. Follow these steps for a complete and permanent removal:
- Go to the Report Templates screen.
- In the list of reports, select the report(s) you want to delete.
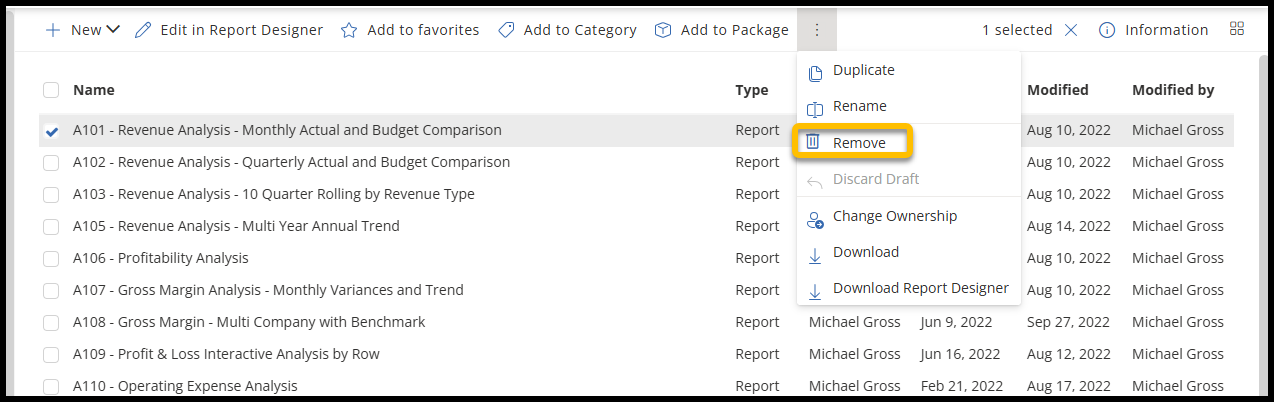
- Click the ellipsis (three dots) in the toolbar and choose Remove.
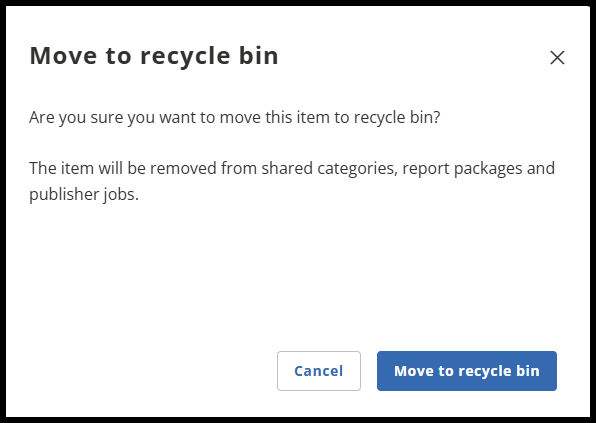
- When a pop-up menu appears, review the message and click Move to Recycle Bin to move these reports to the Recycle Bin. The reports will no longer appear for you or to anyone the report(s) have been shared. Alternatively, click Cancel to exit the process and not remove any reports.
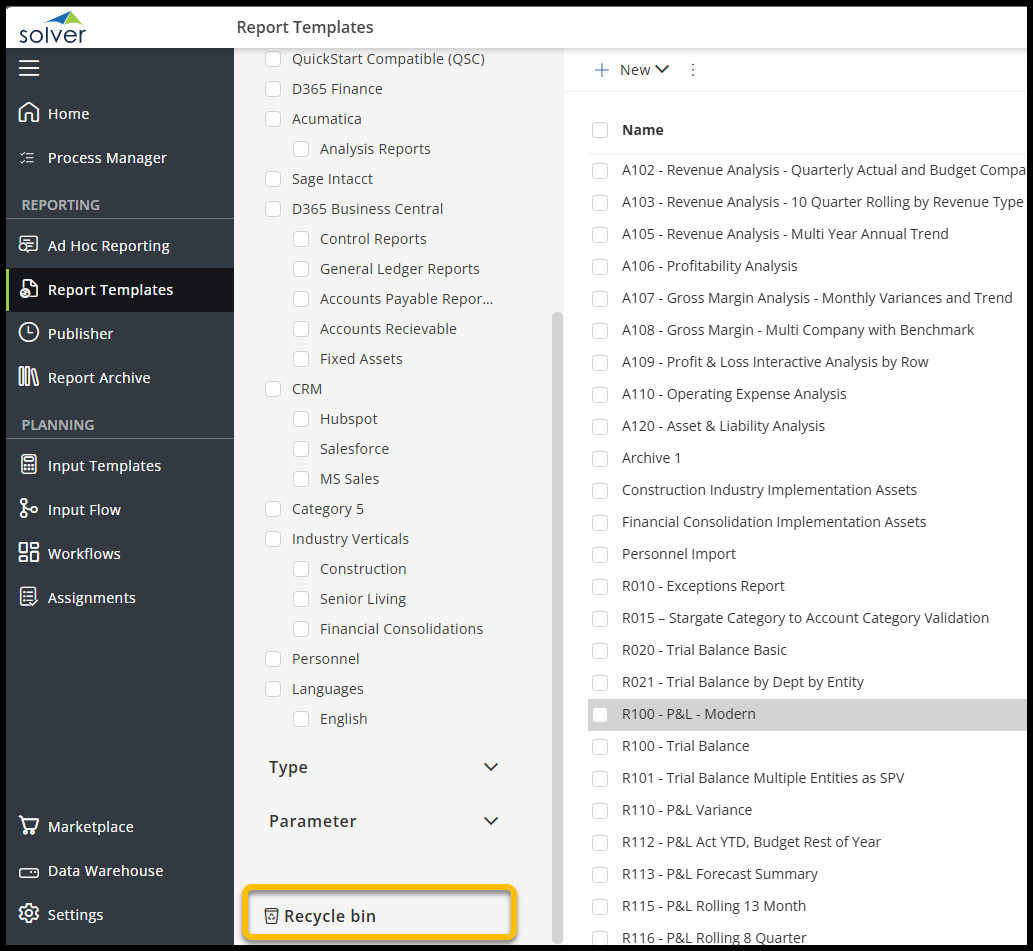
- Navigate to the Recycle Bin tab at the bottom of the Search and Filter pane.
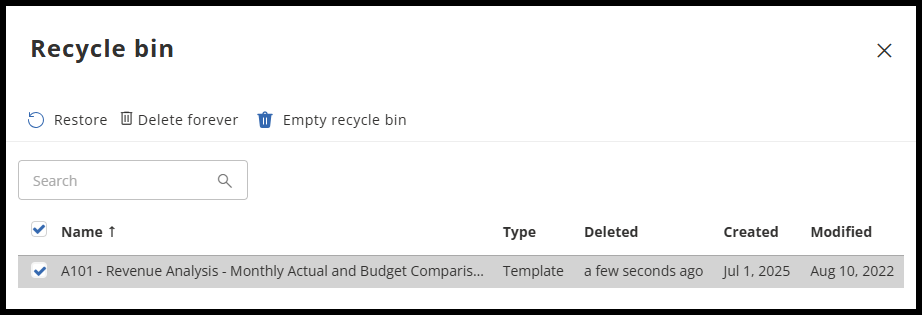
- In the Recycle Bin, select the report(s) you want to permanently delete. Choose Delete Forever to permanently remove them, or Restore to return them to your reports list. You can also empty the Recycle Bin to permanently delete all reports at once.
Archiving a Report
You can archive a report for future reference. The report template will still be available for editing and updating. The report edition that you archive is saved in the archive.
To archive a report from Solver:
- Open the report template using one of these methods:
- Select the report template in the list, and click
 Open.
Open. - Click
 on the report template thumbnail.
 - Double-click the report template in the list.
- Select the report template in the list, and click
- Click
 Send to archive. The button changes to green, and the status is archived.

Favoriting a Report
Favoriting a report or template lets you quickly access it from the Solver Home Page.
To add a report or template to your favorites:
- Go to the Report Templates or Input Templates tab.
- Select a report or template from the list.
- Click the Add to Favorites button in the top toolbar.
- A star will appear next to the name.
- To confirm, return to the Home Page and check the Favorites tab.
- To remove a favorite, repeat the steps above and click Unfavorite.
Sharing Reports
Reports belong to the creator by default and are unavailable to others. The creator/owner of a report can share it using categories. With the appropriate permissions:
- Can manage and create categories
A Report Designer can share reports by category with individual users and/or roles. Solver’s category feature supports a two-level hierarchical structure, allowing users to create a summary level and a more detailed category level.
- Tip: always place reports in the detail-level category, where applicable.
Creating a Category
The first step to sharing a report is to create a Category. To create a category:
- In the search and filter pane, click New Category.
- In the pop-up that appears, enter a descriptive category name, such as “Financials.”
- Type in an optional Description. This description only appears to the creator of the category.
- As mentioned above, there are two levels to a category. If the category you choose is to be the top level, do not select anything from the “Choose Parent Category” dropdown. If the category you are creating should fall under an existing category, select this category from the dropdown list.
- Click Create Category once you are done. Click Cancel to exit the process and not create the category.
Adding Users to a Category
Once a category is added, add users or roles to the category to grant access. To do so:
- As the category owner, hover over the category and click the Share icon.
- Users only get access to that category. If you grant access to the parent category, the user does not get access to the child categories.
- In the pop-up that appears, select the user(s) and/or roles that should have access to this category. Every user in that role will automatically have access to the reports in this category.
Removing Access to a Category
If you want to remove a user(s) from a category
- As the category owner, hover over the category and click the Share icon.
- Uncheck the users who should no longer have access to this category and click Save.
- The next time the user navigates to the Report Templates menu or directly to the report, it will not load.
Editing a Category
Only the creator of a category can edit its name.
- As the creator of the category, hover over the category in the Search and Filter pane and click the Pencil icon to edit.
- In the pop-up that appears, the current category name will appear. Type in the new name.
- If you wish to move this category to another category, select the correct category from the dropdown list.
- Click Save. Click Cancel to exit the process and not change the category name.
Deleting a Category
Only the creator of a category can delete a category. Deleting a category will not delete the reports added to it. Deleting a category will
- Delete the category
- Remove access to the reports added to this category for users who this category was shared with.
To delete a category
- As the creator of the category, hover over it in the Search and Filter pane, then click the Trash Can icon to delete.
- A pop-up will appear asking you to confirm the action. Click Delete to delete the category or click Cancel to exit.
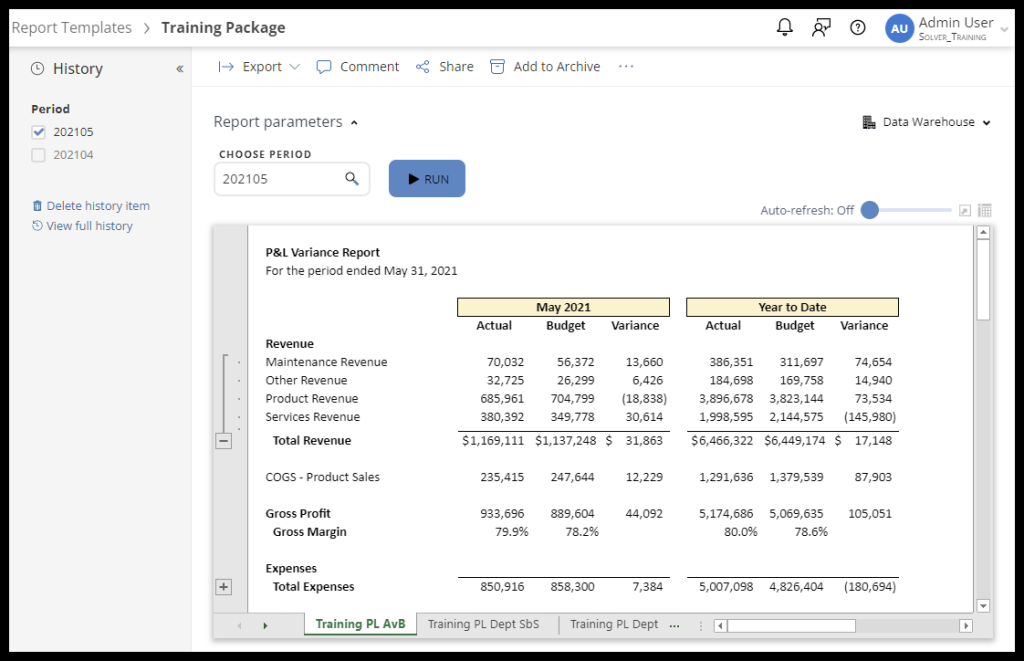
Opening and Running Reports
Once you have created a report for yourself or need to view reports shared with you, follow these steps.
- Navigate to Report Templates
- To open the report, whether in list or card view, click on the title of the report.
- Type in the applicable parameters that have been created for this report and hit the Run button.
Depending on the style and amount of data this report is designed to process, reports can run in seconds or minutes. If a report is large, it may be placed in a queue when running the report is initialized. Users can see the current status of report processing. An on-screen message next to the Run button displays the real-time status of report processing after execution begins. This is located next to the run button after it has been pressed.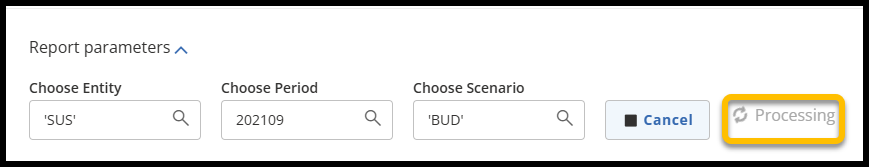
When viewing or editing a report, users may need to perform certain calculations based on the report’s data. To quickly find these calculations, select several cells and look at the bottom right corner of the page to see the sum, count, and average of these data points. 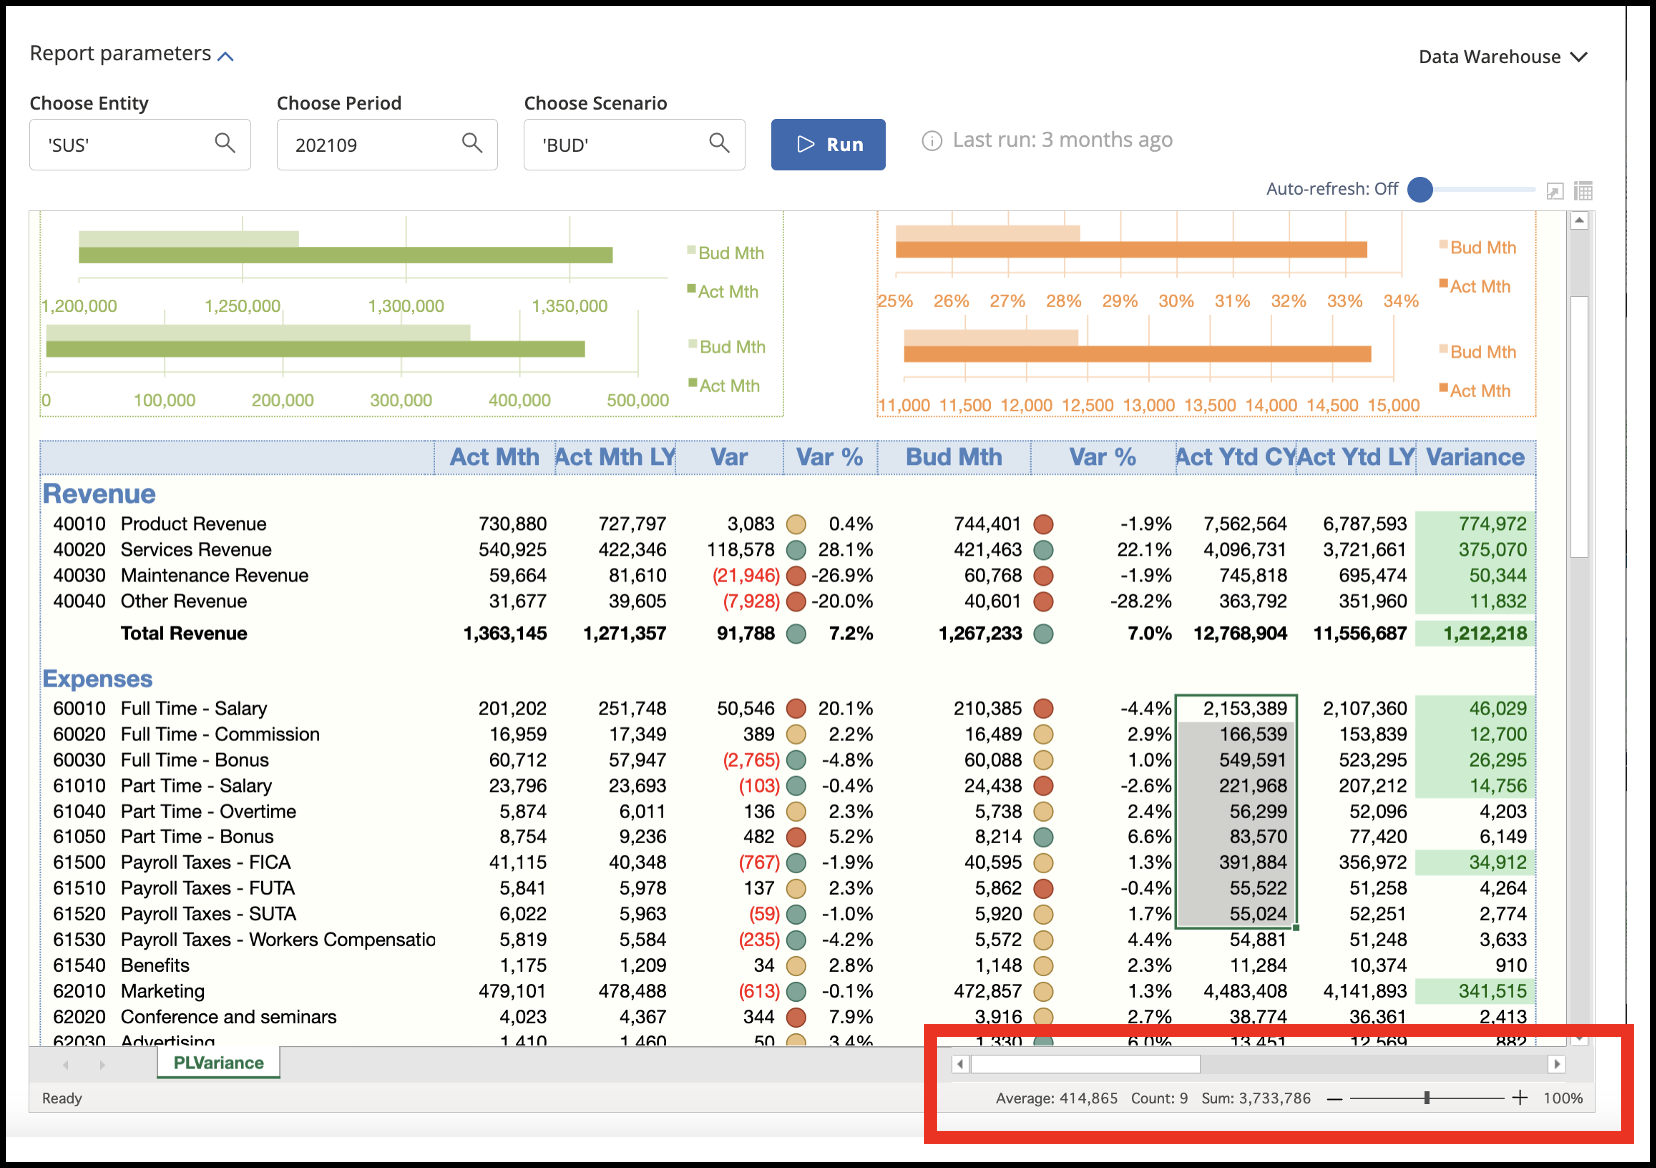
Report History
The left-hand pane shows the parameters of the last 10 executions. You can click on any of these parameter options to view a prior execution.
Click the Delete History Item to remove the selected prior execution.
Report Packages
You can package multiple report templates to display each report template as a sheet in an Excel workbook. Once run, packages may be exported as a multi-tab Excel workbook or as a PDF. It is important to understand that packages are simply a way to run and export multiple templates together. Each template will continue to exist independently and is not affected by being deleted from a package or by a package being deleted.
Creating a Package
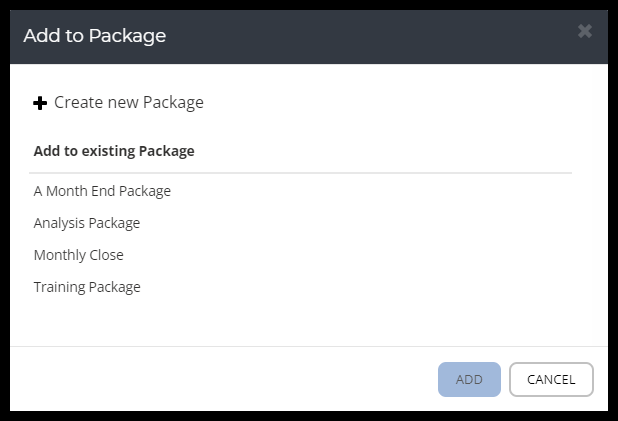
To define a new package, select one or more templates, click Add to Package, and Create new Package. You can also add templates to any existing packages that you own (meaning you created the package yourself or ownership was transferred to you).
Packages that you own may also be edited. This will allow you to remove templates from the package or change their display position.
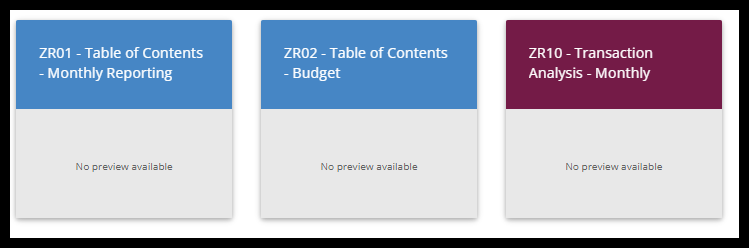
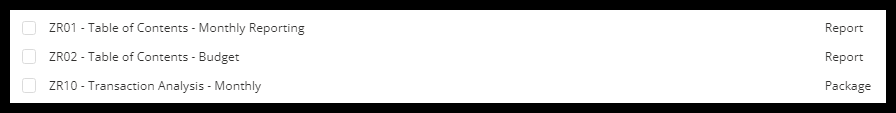
In card view, packages will appear as burgundy cards, while in list view, they will simply be labeled “Package”.
Card View:
List View:
Running a Report Package
To open a package, click the title, just like you would when running a report. Packages display like an Excel workbook, with a tab for each report. If a report design includes multiple sheets (tabs), the title is appended by the sheet name, e.g., PL-100, PL-200, etc.
Parameters are based on the templates that are included in the package. Multiple templates in a package that share the same parameter (Period, for example) may be run for only a single entry. So, for example, if one template needs to be run for 202105 and another for 202212, they will need to be in separate packages or run individually.
Templates in Draft mode may be added to a package, but the package cannot be run until all its templates are published.
Sharing
Packages may be shared via Categories just like individual templates. All templates in the package must be published to be shared. Any subsequent changes to templates will also have to be published.